🎒Visualizing Education: An Exploration of Massachusetts Schools
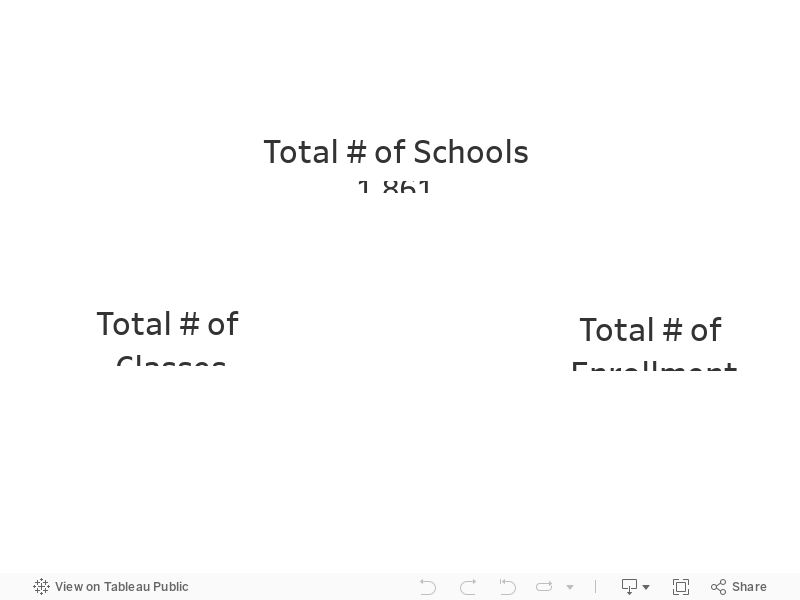
Comprehensive Overview: Total Number of Schools, Enrollment, and Classes
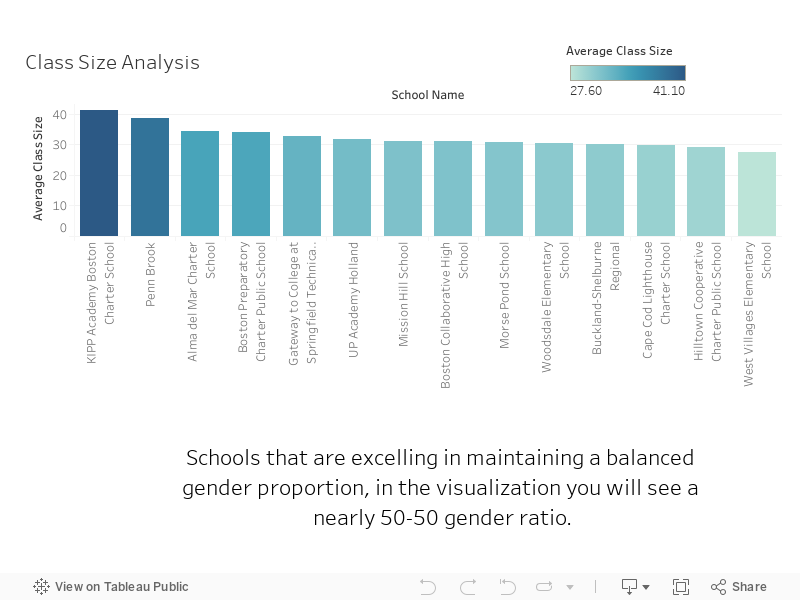
Class Size Analysis with Gender Ratio Insights
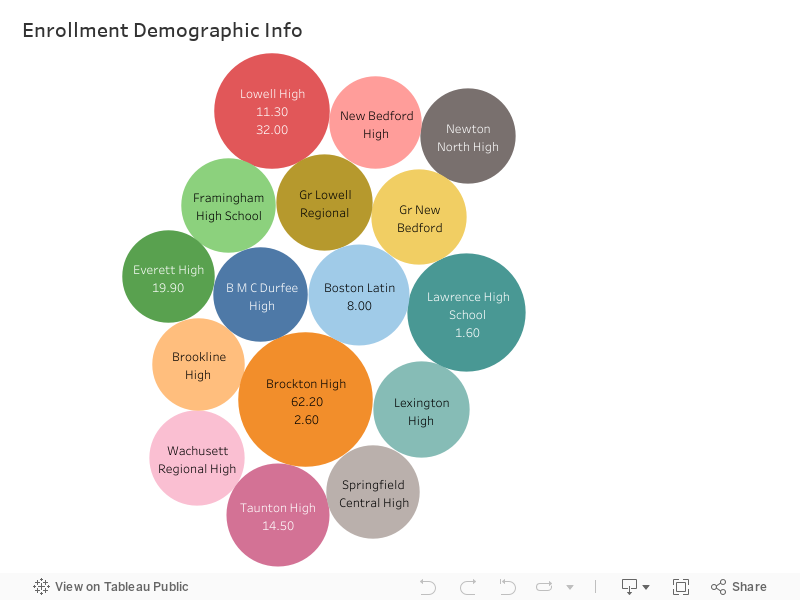
Detailed Enrollment Demographics Breakdown
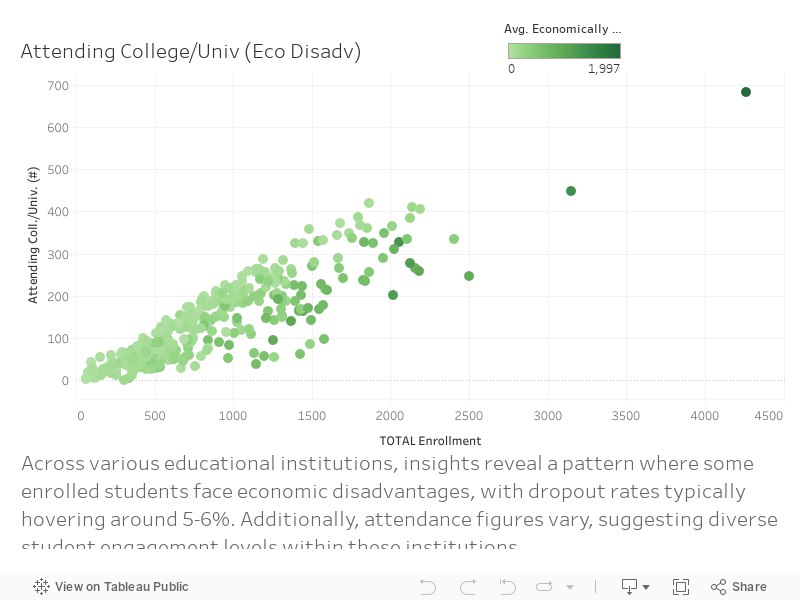
Economic Disadvantage and College Attendance: Student Insights
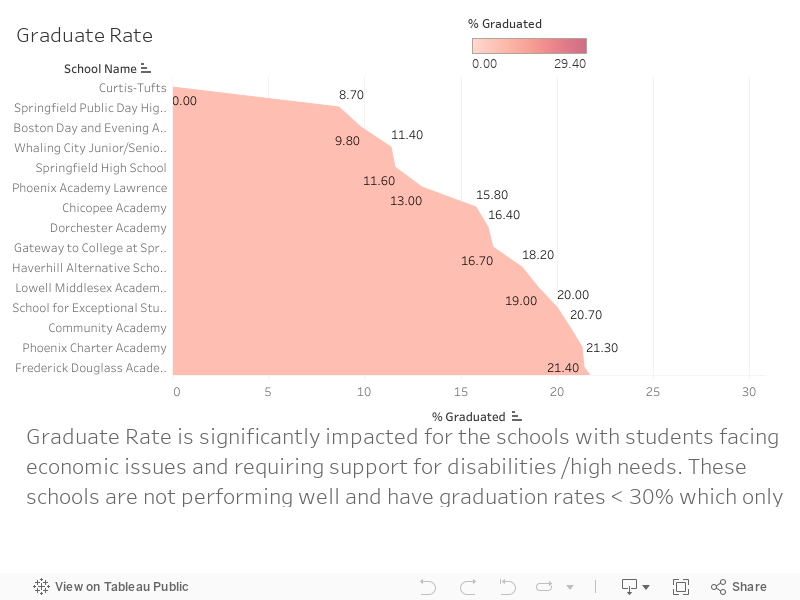
Graduation Rates Plummet Below 30% in Schools Lacking Resources for Economically Disadvantaged and High-Needs Students
Despite being from 2017, the data offers valuable insights that remain relevant today. The main columns that formed the core of this analysis include:
-- % Graduated, % Dropped Out
-- School Name
-- Average Class Size
-- % Attending College
-- % of Economically Disadvantaged
-- High Needs/Students with Disablities,
-- Gender/Race and TOTAL Enrollment.